Program Metrics
Introduction
The sail on metrics evaluates the agents using two criteria
Detecting the instance when novelty was introduced.
Reacting and recovering from novelty.
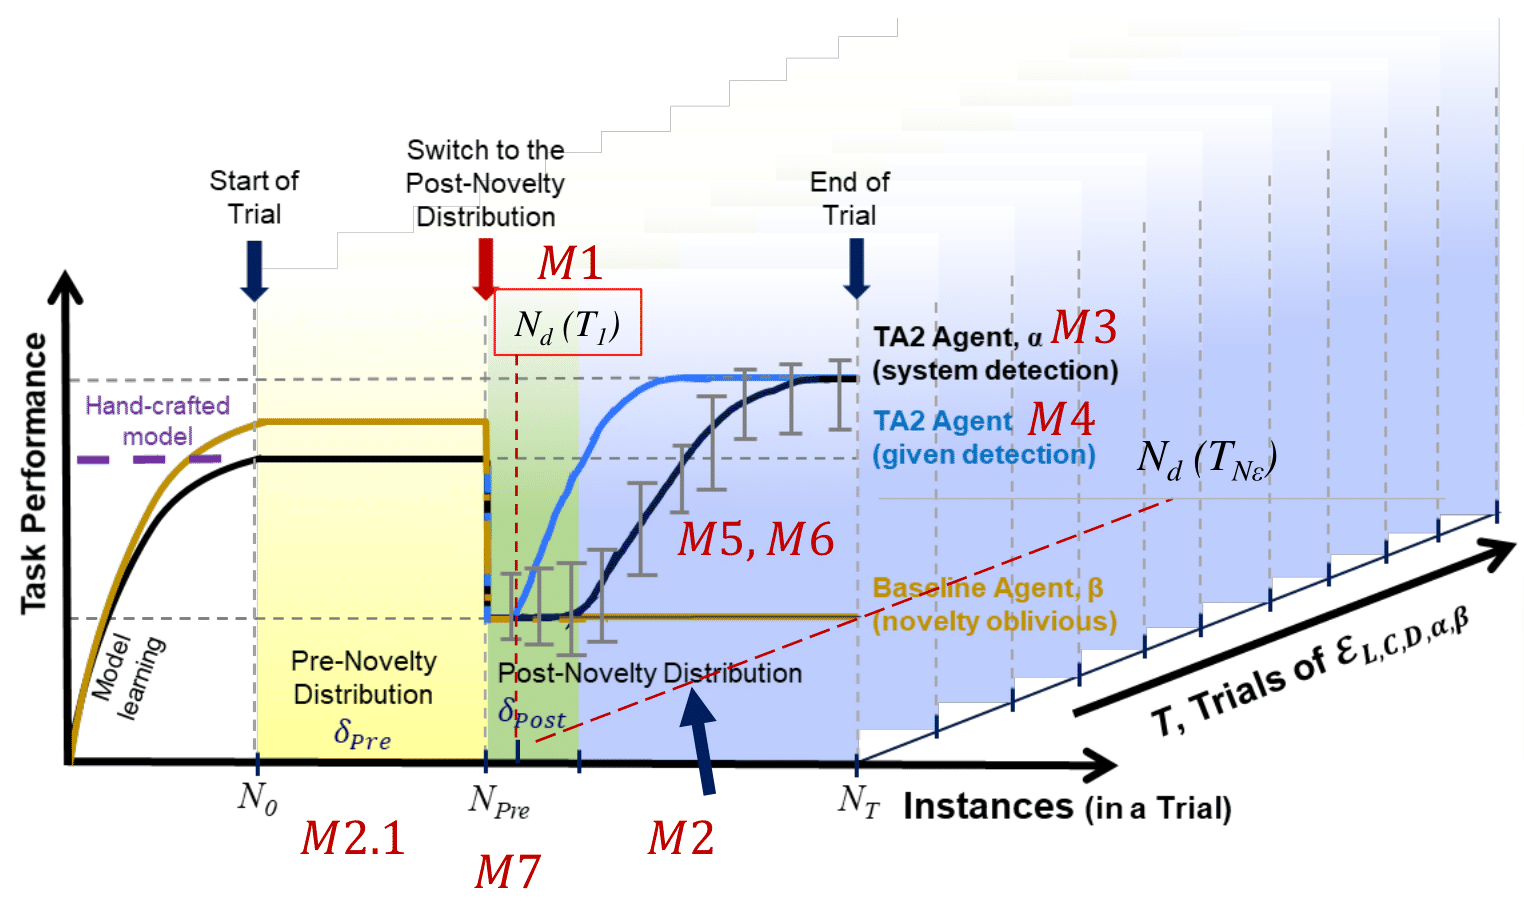
The figure below shows the different points where the metrics are calculated.
Symbols and Terms
L: Novelty Level (L \(\in\) [1,3])
C: Condition (C \(\in\) [System Detection, Given Detection])
D: Domain (D} \(\in\) [Visual Classification, Document Transcription, Activity Recognition])
\(\delta_{pre}\): A distribution of (pre novelty) instances from D at L = 0
\(\delta_{post}\): A distribution of (post novelty) instances from D at L \(\geq\) 0
\(T_{pre}\): A sequence of instances drawn from \(\delta_{pre}\)
\(T_{post}\): A sequence of instances drawn from \(\delta_{post}\)
\(T\): A sequence of instances with \(T_{pre}\) and \(T_{post}\)
\(\alpha\): A TA2 agent
\(\beta\): A Baseline agent
\(\mathcal{E}_{L,C,D,\alpha,\beta}\): A set of \(\langle\) L,C, D \(\rangle\) on \(\alpha\) and \(\beta\)
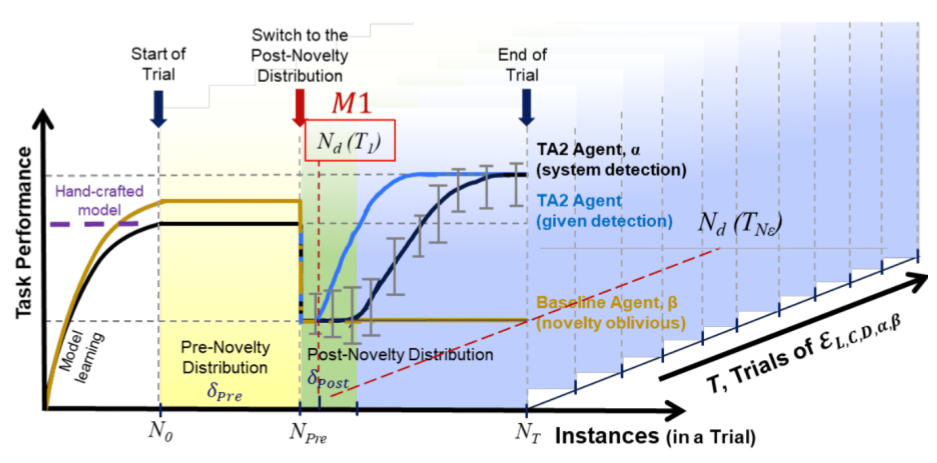
M1: Average Number of FNs among Correctly Detected Trials (⬇ is better)
The goal of the metric is to measure the distance between when novelty was introduced and when the agent declared that the world changed.
Note
M1 is only computed across correctly detected tests.
Formal Definition
Let \(\delta(\alpha, x)\) be the agent’s distribution on instance x
Pictorial Representation
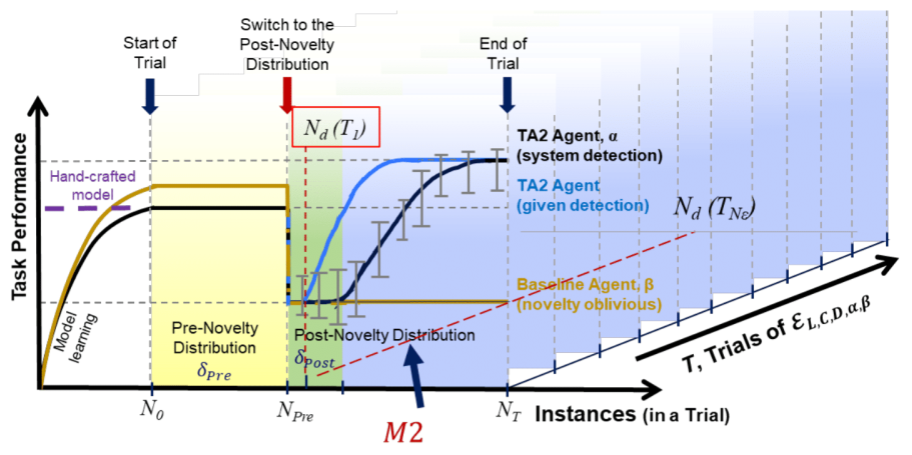
M2: Percentage of Correctly Detected Trials (⬆ is better)
The goal of the metric is to measure the number of tests when agent declares that the world has changed after the novelty is introduced in a test.
Formal Definition
Pictorial Representation
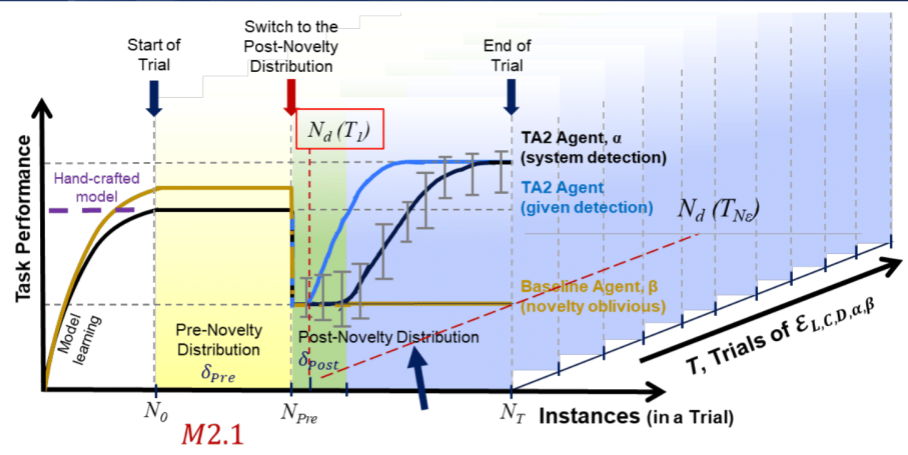
M2.1: Percentage of False Positive Trials (⬇ is better)
The goal of the metric is to measure the number of tests when agent declares that the world has changed before the novelty is introduced in a test.
Formal Definition
Pictorial Representation
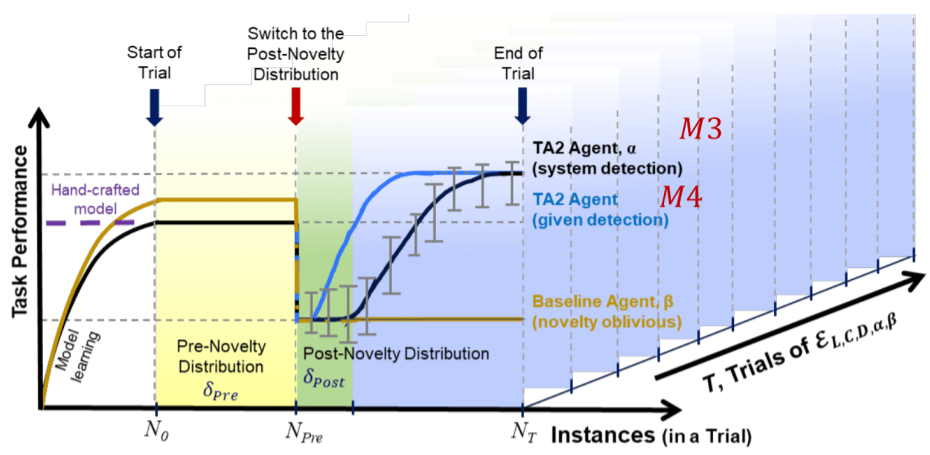
M3 and M4: Novelty Reaction Performance (⬆ is better)
The goal of the metric is to measure the performance of the agent post novelty when compared to a baseline before novelty was introduced. The performance of the agent is measure over asymptotic samples.
Note
The asymptotic samples for a test is the last 100 samples in the test.
Formal Definition
Let \(P_{pre, \beta}\) be baselines average task performance on \(T_{pre}\) and \(P_{post,\alpha}\) be the agents asymptotic task performance on \(T_{post}\)
Pictorial Representation
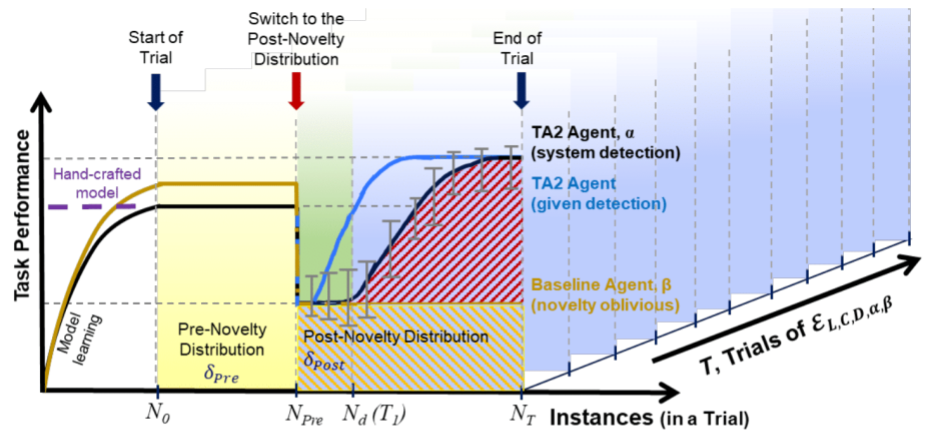
M5: Overall Performance Task Improvement (⬆ is better)
The goal of the metric is to measure the performance of the agent post novelty when compared to the performance of the baseline and the agent post novelty.
Formal Definition
Let \(P_{post, \beta}\) be baselines average task performance on \(T_{post}\) and \(P_{post,\alpha}\) be the agents task performance on \(T_{post}\)
Pictorial Representation
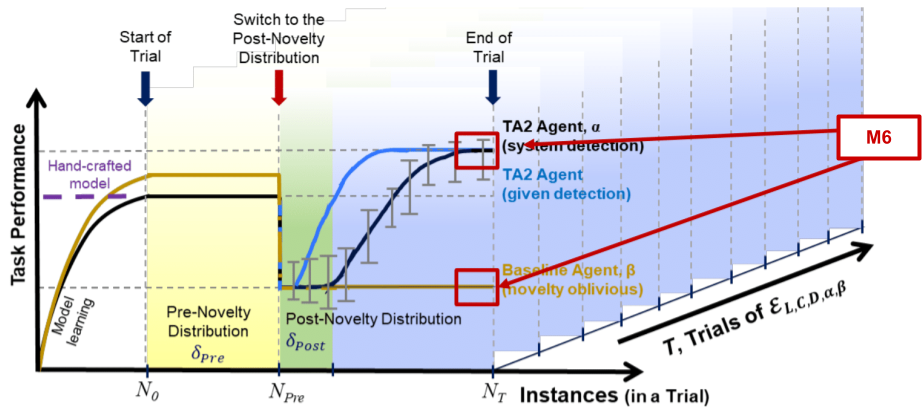
M6: Asymptotic Performance Task Improvement (⬆ is better)
The goal of the metric is to measure the performance of the agent post novelty when compared to the performance of the baseline and the agent post novelty for asymptotic samples.
Note
The asymptotic samples for a test is the last 100 samples in the test.
Formal Definition
where \(m\) is asymptotic width that is domain dependent
Pictorial Representation